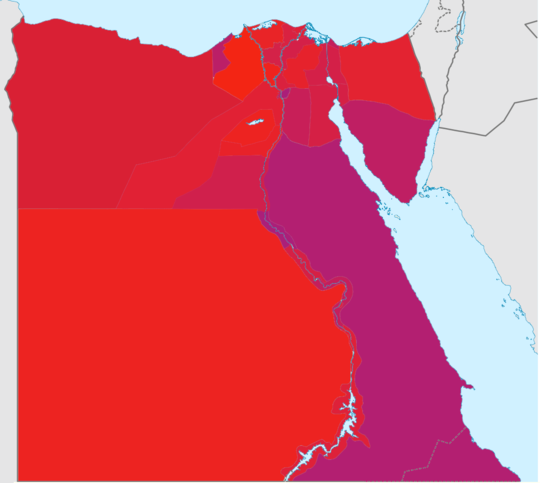
Mapping Egypt's referendum
As I've said before, Egyptians voted yes or no for different reasons (a flaw in the design of the referendum), but even so I thought it'd be interesting to draw up a US-style red vs. blue map showing the trends across Egypt's 29 governorates. The most red governorates are those with the highest percentage of "yes" votes, the more blueish ones (actually purple, since the lowest "yes" vote was around 60% in Cairo governorate) have more "no" votes.
What does this tell us? Basically, that governorates with a large urban population (Cairo, Alexandria, Giza, Assiut) had a higher proportions of "no" votes, as did those sparsely populated governorates that have a large proportion of tourism workers (Red Sea, South Sinai, Luxor). Areas where tribes count more tended to have a high "yes" vote (Wadi Gedid, Marsa Matruh, North Sinai). I've done more number-crunching extrapolating from census figures to guestimate participation by governorate, but I'll put that information up later this week.
One caveat: the allegations of fraud and Copts being barred from voting in Qena governorate really need to be investigated to know whether the result for that governorate can be taken as representative.

